[Industry news] Catfish leads the pack in record US seafood import year
10 February 2017
[Reposted from Undercurrentnews, find the original article here, we are not in anyway responsible for the content of this post]
In this record year for US seafood imports, volumes of most major species imported in the United States increased, and catfish—by far—led the pack.
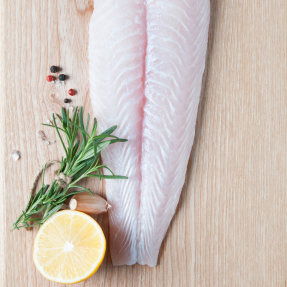
Catfish volumes — the bulk of which is pangasius from Vietnam — increased 20.4% year-on-year in 2016 despite the entrance of the catfish inspections program, a regulatory hurdle that the National Fisheries Institute has publicly reviled since its passage with the 2014 Farm Bill.
The program transfers catfish regulatory power from the US Food and Drug Administration (FDA) to the US Department of Agriculture (USDA). It took effect last March, but its 18-month phase-in period is ongoing; and the USDA has yet to fully implement it.
“The real test will come in September. That’s when we’ll start to see what the import volume impact is,” Gavin Gibbons, vice president of communications for the National Fisheries Institute, told Undercurrent News.
Come September, the USDA will require countries to go through an equivalency process to get their products accepted into the United States, a USDA spokesperson told Undercurrent.
As Undercurrent reported in January, Vietnamese pangasius sellers and US importers face a possible shutdown in trade on Sept. 2, after the failure of efforts to repeal the shift from the FDA to the USDA on catfish inspection.
“We would encourage the USDA to work with countries like China, like Vietnam, through this equivalence process so that they can come up to speed with the new requirements,” Gibbons said. “Without any help, that’s not a regulatory switch, that’s a trade barrier.”
In total, seafood import volumes hit 2.8 million metric tons in 2016, up from 2.7m in 2015 and 2.6m in 2014, National Oceanic and Atmospheric Administration records show. Import volumes have been rising relatively steadily throughout the past decade.
In 2016, import volumes of shrimp, salmon also increased, but those of tilapia and tuna decreased.
Shrimp volumes increased 3.12%, from 586,735t in 2015 to 605,064t in 2016.
Meanwhile, salmon volumes increased 2.45%, from 344,619t in 2015 to 353,090t in 2016.
Volumes for tilapia, in a stark departure from the upward trend, saw volumes decrease 12.4%, from 225,059t in 2015 to 197,239t in 2016.
Tuna volumes decreased more mildly, by 2.7%, from 262,285t in 2015 to 255,287t in 2016.
For the most part, average prices tended to rise or fall according to these volume changes. For instance, the average price of imported catfish in 2016 dropped slightly, from $3.09 per kilogram in 2015 to $2.96/kg in 2016, as volumes increased 20.4%.
However, salmon defied normal market dynamics. Despite the volume increase, prices rose from an average of $7.87/kg in 2015 to an average of $9.09/kg in 2016.


![Demystifying Pangasius: Debunking Common Myths and Misconceptions 3 41 [All in Fillets] 2901 1 HIGH](https://www.vinhhoan.com/wp-content/uploads/2024/06/41_All-in-Fillets-2901-1-HIGH-683x490.jpg)


